A single application that brings together, consolidates, and explains business activity in depth, enabling decision-makers to act quickly thanks to reliable, consistent indicators updated every day.
A consolidated view for every decision-making level
A clear understanding of revenues and profitability
Reliable, reconciled and immediately actionable indicators
Dynamic management that answers every new question
Comprehensive analysis of business activity in a single application
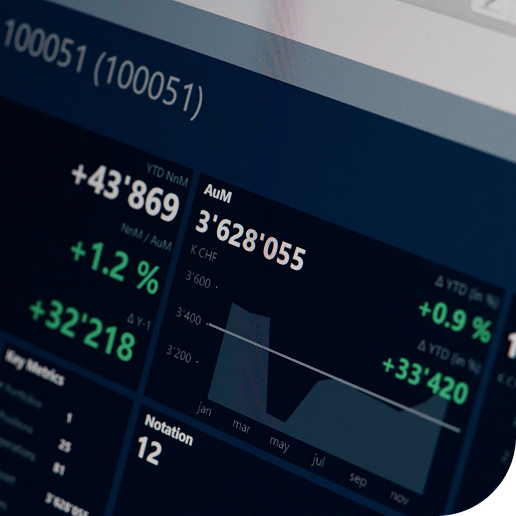
The MIS application centralizes all the information needed to manage performance. Decision-makers can monitor activity by Business Units, entities, desks or RMs. They can also explore portfolios by client profiles, domicile or risk levels. Each view helps them understand how AuM, NnM, ReV or RoA are evolving. Management becomes fluid, consistent and immediately actionable.
Granular exploration of client, portfolio and position data
The application makes it possible to drill down into operational detail. Decision-makers can analyze portfolios by category, sector, asset class or management type. They can trace each position and understand the source of a gap, a revenue stream or a variation. Data stops being static and becomes a reliable lever for continuous analysis.
Advanced and standardized analytical calculations for profitability
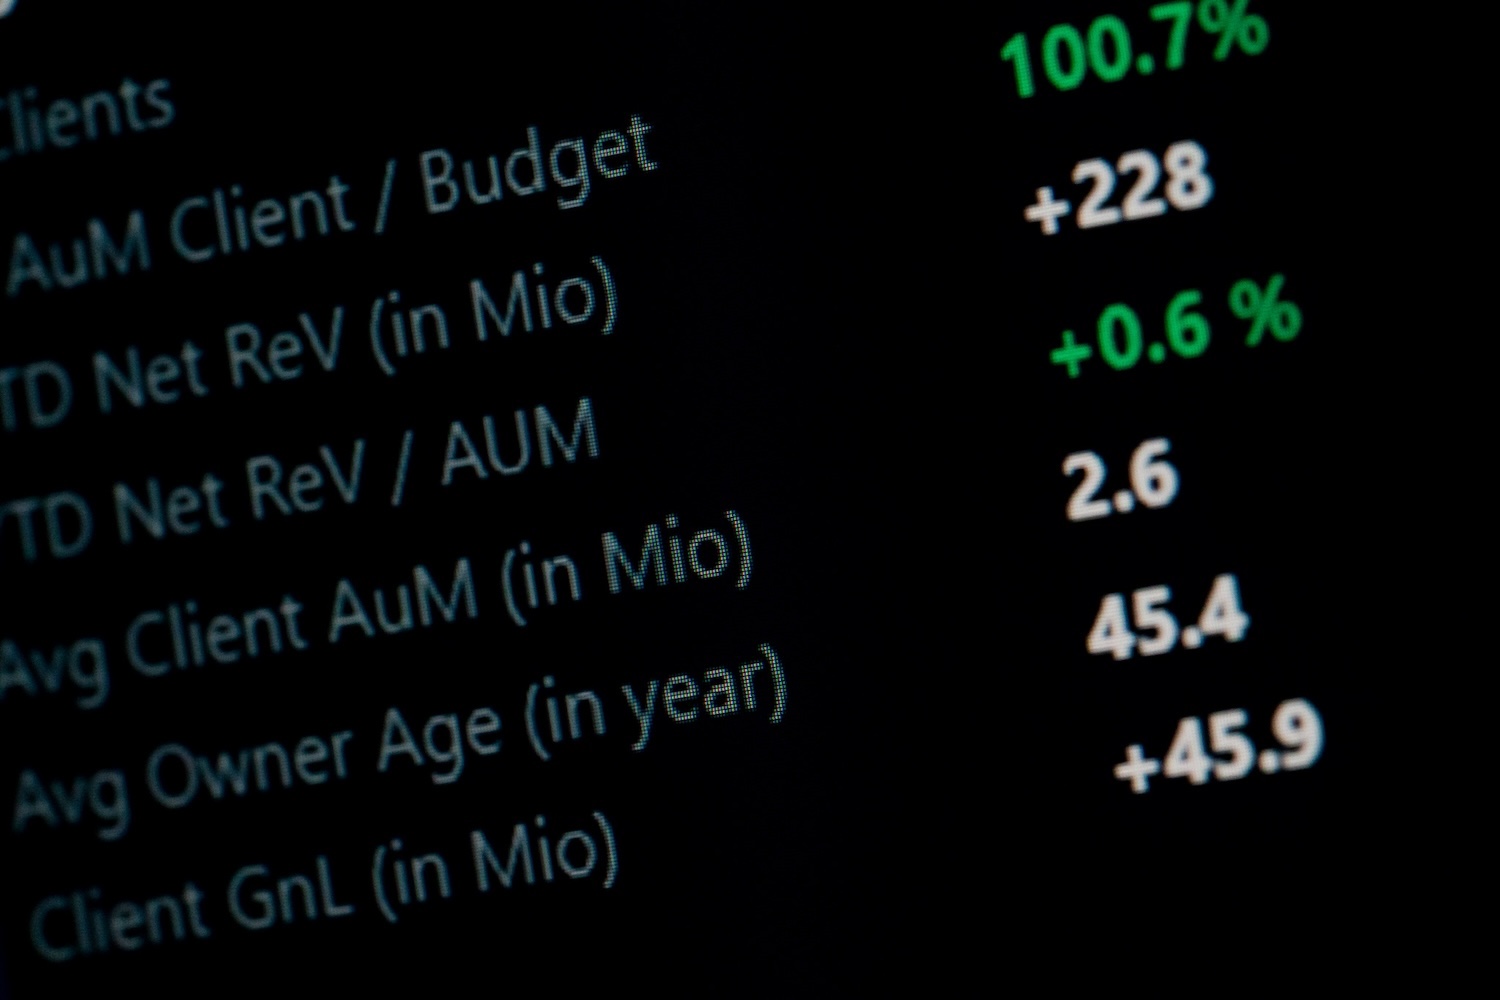
Beyond consolidation, the application calculates key indicators: revenue grouping, spreads, accruals, interest or cost of funds. It also industrializes complex topics such as retrocessions. These calculations are documented, standardized and aligned so the entire organization works with the same figures
Full transparency and operational traceability down to the transaction level
Every figure can be explained. Every aggregate can be broken down. The application allows users to trace data back to the source, transaction by transaction. This transparency eliminates silos, removes multiple versions of the same indicator and reduces internal debates. A shared data dictionary ensures a common, coherent and controlled language.
How does the MIS application guarantee a unified and consistent view of business indicators?
The application is built on a documented and standardized data dictionary, enabling all teams to speak the same language. Indicators are calculated once and shared across the entire organization. This removes redundancy, harmonizes methods and ensures that the CEO, CFO, COO and operational teams all work from the same source of truth.
Can views and analyses be customized according to business roles?
Yes. The application fully adapts to the needs of decision-makers. The CEO can track the evolution of AuM and profitability. The CFO can monitor revenues, costs and budget variances. The COO can analyze operations and volumes. Relationship Managers only see their own clients, portfolios and positions. Each role gets the depth of analysis it needs.
How does the application make daily activity monitoring easier?
Data is updated every day to provide a J-1 view of the entire business. This removes static PDFs and manual consolidations. Every morning, teams have a clear view of AuM, NnM, ReV, costs and key variations. They can react faster and with less uncertainty.
How does the application improve understanding of revenues and costs?
All revenue and cost components are analyzed, grouped and explained. The application makes it possible to distinguish recurring and non-recurring revenues, retrocessions and spreads. Direct and indirect costs are also integrated. Decision-makers gain a precise view of RoA, margin by segment and overall profitability.
Can the application answer unexpected questions quickly?
Yes. This is one of its founding principles. Any exploration can be pursued without limit: an aggregate leads to a portfolio, a portfolio to a position, and a position to an operation. Decision-makers no longer depend on Excel files or IT tickets. The answer to the “next question” is available within seconds.
How does the application handle security and access rights?
Security is built in natively. Each user sees only what is intended for them. An RM accesses their own clients, a Head of PB views their own scope, and central functions get a consolidated view. Access rights provide controlled transparency while protecting the integrity of sensitive information.
How does the application process data from multiple sources?
The application consolidates data from accounting, core banking, the PMS and other internal systems. It aligns them within a single, structured model, avoiding inconsistencies and duplicates. Analytical calculations are then applied uniformly, ensuring solid and reliable indicators.
How does the application accelerate strategic decision-making?
By providing reliable, controlled and immediately usable information. Decision-makers gain a clear reading of trends, risks, results and revenue dynamics. Trade-offs become faster, budgets more precise and action plans more coherent. The application directly supports strategy execution.